OpenTelemetry (OTEL) Integration
Overview
Section titled “Overview”OpenTelemetry (OTEL) is a vendor-neutral, open standard for collecting observability data from software systems. It provides a unified way to capture three types of signals:
- Traces (Spans) — track the execution of individual operations across services, capturing timing, status, and contextual attributes for each step in a request lifecycle.
- Logs — record discrete events that occurred within a service, such as audit actions, state changes, errors, or informational messages, along with structured metadata.
- Metrics — report aggregated measurements over time, such as latency percentiles, success rates, and error counts, grouped by granularity and frequency.
Why OTEL with Obsrv?
Section titled “Why OTEL with Obsrv?”Raw OTEL payloads use a deeply nested, key-value array structure (e.g., [{"key": "foo", "value": {"stringValue": "bar"}}]) that is designed for portability but is not directly queryable. Obsrv addresses this by providing an OTEL service that acts as a translation layer — it receives raw OTEL signals, flattens them into clean JSON objects, and feeds both representations into the Obsrv data pipeline via Kafka.
This means you can instrument your services with standard OTEL SDKs without any Obsrv-specific changes, and still get fully indexed, queryable datasets with no manual schema wrangling.
Supported signal types
Section titled “Supported signal types”| Signal | OTEL payload key | Obsrv eid | Use case |
|---|---|---|---|
| Traces | resourceSpans | API | API call tracing, latency, error tracking |
| Logs | resourceLogs | AUDIT | Audit trails, state change events, error logs |
| Metrics | resourceMetrics | METRIC | Aggregated KPIs — latency, throughput, error rates |
Data flow
Section titled “Data flow”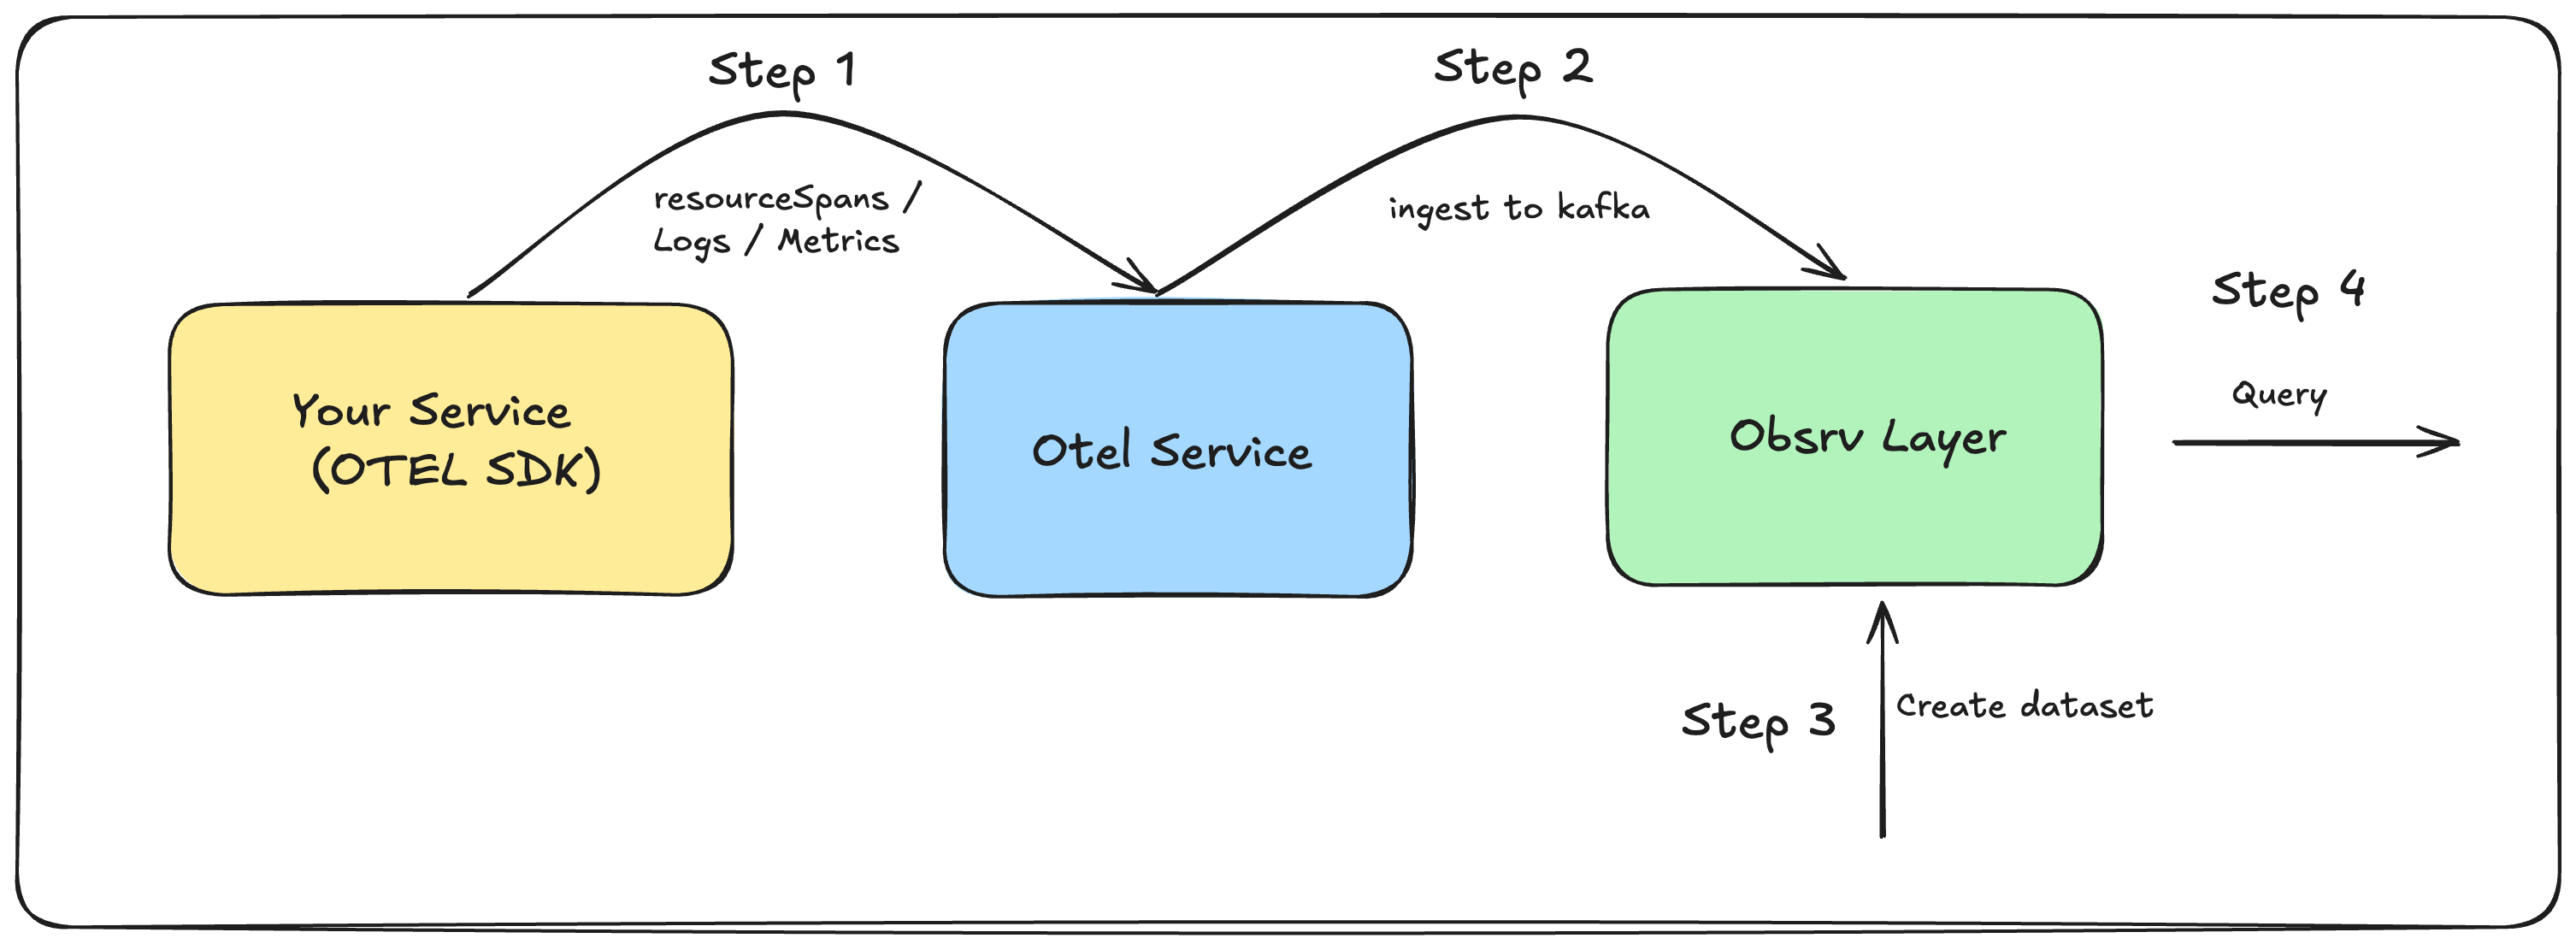
What the OTEL service does:
- Receives raw OTEL payloads over HTTP.
- Unpacks the nested attribute arrays and
kvlistValuestructures into flat key-value JSON. - Promotes resource-level fields (
eid,producer,producerType) and scope-level fields (name,version,scope_uuid,count) to the top level. - Writes the raw event and the flattened event to two separate Kafka topics in parallel.
- The flattened events are consumed by Obsrv and indexed into the configured dataset.
Step 1 — Emit OTEL events from your service
Section titled “Step 1 — Emit OTEL events from your service”Use any OpenTelemetry SDK to instrument your service. The OTEL service accepts all three standard signal types.
Traces (Spans)
Section titled “Traces (Spans)”Emitted as resourceSpans. Each span captures a single operation — e.g., an API request — including timing, status, and any error events.
{ "resourceSpans": [{ "resource": { "attributes": [ { "key": "eid", "value": { "stringValue": "API" } }, { "key": "producer", "value": { "stringValue": "iam" } }, { "key": "producer.type", "value": { "stringValue": "Facilitator" } } ] }, "scopeSpans": [{ "scope": { "name": "iam_service", "version": "1.0.0", "attributes": [ { "key": "scope.uuid", "value": { "stringValue": "874d0df2-224a-4bea-9e0c-303995a38937" } }, { "key": "count", "value": { "intValue": 1 } } ] }, "spans": [{ "name": "userTokenGenerationV1", "startTimeUnixNano": "1747805502725834184", "endTimeUnixNano": "1747805507924834184", "status": "Ok", "traceId": "a923d739-774a-4e90-959c-21f064e586f1", "spanId": "95cce13d-bfb1-4ce6-9891-ad7d2d21ac03", "attributes": [ { "key": "sender.id", "value": { "stringValue": "ma****@test.in" } }, { "key": "span.uuid", "value": { "stringValue": "a1e082c3-3c36-40cb-bec5-643925259a2f" } }, { "key": "observed.time.unix.nano", "value": { "stringValue": "1747805502725806984" } }, { "key": "request.method", "value": { "stringValue": "POST" } }, { "key": "request.url", "value": { "stringValue": "/v1/user/token/generate" } }, { "key": "response.status.code", "value": { "stringValue": "200" } }, { "key": "response.time.ms", "value": { "stringValue": "5199" } } ] }] }] }]}When a span contains an error, include an events array:
"events": [{ "name": "error", "time": "2025-05-21T05:33:48.324173Z", "attributes": [ { "key": "msg", "value": { "stringValue": "Invalid username/password" } }, { "key": "code", "value": { "stringValue": "TKN_2025" } }, { "key": "type", "value": { "stringValue": "UNAUTHORIZED" } } ]}]Emitted as resourceLogs. Each log record captures a discrete event — e.g., an audit action — with severity, body text, and structured state attributes.
{ "resourceLogs": [{ "resource": { "attributes": [ { "key": "eid", "value": { "stringValue": "AUDIT" } }, { "key": "producer", "value": { "stringValue": "iam-service" } }, { "key": "producerType", "value": { "stringValue": "IAM" } } ] }, "scopeLogs": [{ "scope": { "name": "iam_service", "version": "1.0.0", "attributes": [ { "key": "scope_uuid", "value": { "stringValue": "df928931-107e-4539-9b21-e01f3a137b53" } }, { "key": "count", "value": { "intValue": 1 } } ] }, "logRecords": [{ "timeUnixNano": 1747138337071, "observedTimeUnixNano": "1747138337071729909", "severityNumber": "12", "traceId": "ee36cf84-ce43-42a3-8384-a6b087fc0823", "spanId": "2dc6e05c-68ac-4b67-880e-4afd85784989", "body": { "stringValue": "User Create" }, "attributes": [ { "key": "type", "value": { "stringValue": "User" } }, { "key": "status", "value": { "stringValue": "OK" } }, { "key": "id", "value": { "stringValue": "te**********@yopmail.com" } }, { "key": "log_uuid", "value": { "stringValue": "16ce4388-4ce5-4921-9b2e-b024aec28f62" } }, { "key": "state", "value": { "kvlistValue": { "values": [ { "key": "email", "value": { "stringValue": "te**********@yopmail.com" } }, { "key": "username", "value": { "stringValue": "te**********@yopmail.com" } }, { "key": "firstname", "value": { "stringValue": "test" } }, { "key": "lastname", "value": { "stringValue": "user" } } ]}}} ] }] }] }]}Metrics
Section titled “Metrics”Emitted as resourceMetrics. Each metric payload can carry multiple named measurements — e.g., latency percentiles, error rates — bundled under a single scope and aggregated over a time window.
{ "resourceMetrics": [{ "resource": { "attributes": [ { "key": "eid", "value": { "stringValue": "METRIC" } }, { "key": "producer", "value": { "stringValue": "APP1" } }, { "key": "producerType", "value": { "stringValue": "App" } } ] }, "scopeMetrics": [{ "scope": { "name": "metrics_service", "version": "1.0", "attributes": [ { "key": "scope_uuid", "value": { "stringValue": "9db4-325096b39f47" } }, { "key": "checksum", "value": { "stringValue": "120EA8A25E5D487BF68B5F7096440019" } }, { "key": "count", "value": { "intValue": 8 } } ] }, "metrics": [ { "name": "latency_avg_ms", "unit": "ms", "sum": { "aggregationTemporality": 1, "isMonotonic": false, "dataPoints": [{ "asDouble": 1153.1718, "startTimeUnixNano": "1544712660000000000", "endTimeUnixNano": "1544712661590000000", "attributes": [ { "key": "metric_uuid", "value": { "stringValue": "43kr3d5f-3cfb-4e6e-b6a2-0ee5d6508923" } }, { "key": "observedTimeUnixNano","value": { "stringValue": "1581452772000000321" } }, { "key": "metric.code", "value": { "stringValue": "latency_avg_ms" } }, { "key": "metric.category", "value": { "stringValue": "Usage" } }, { "key": "metric.label", "value": { "stringValue": "Average Latency in ms" } }, { "key": "metric.granularity", "value": { "stringValue": "minute" } }, { "key": "metric.frequency", "value": { "stringValue": "10-min" } } ] }] } } ] }] }]}Note: Multiple metrics can be included in a single
scopeMetrics.metricsarray. The sample data includeslatency_avg_ms,latencyP50_ms,latencyP95_ms,latencyP99_ms,success_percent,timeout_percent,server_error_percent, andclient_error_percent.
Timing for metrics:
startTimeUnixNanoshould be the window start (e.g., 10 minutes before the request), andendTimeUnixNanoshould be the time of the request.
Step 2 — Set up and run the OTEL service
Section titled “Step 2 — Set up and run the OTEL service”The OTEL service is the transformation layer between your instrumented services and Obsrv. It receives raw OTEL payloads, flattens them into a queryable structure, and publishes both representations to Kafka.
Repository: https://github.com/Sanketika-Obsrv/otel-service
Prerequisites
Section titled “Prerequisites”- Node.js 20+
- Kafka broker accessible from the service
- An Obsrv dataset already created (or planned) — the
dataset-idin the API path must match the Obsrv dataset ID
Installation and setup
Section titled “Installation and setup”Clone the repository:
git clone https://github.com/Sanketika-Obsrv/otel-service.gitcd otel-serviceInstall dependencies and start locally:
npm installnpm startThe service starts on port 3000 by default.
Run with Docker:
docker build -t otel-service:latest .docker run -p 3000:3000 \ -e kafka_host=<your-kafka-host> \ -e kafka_port=9092 \ -e system_env=dev \ otel-service:latestDeploy to Kubernetes using Helm:
helm install otel-service ./helm-chart \ --set config.kafka_host=<your-kafka-host> \ --set SYSTEM_ENV=devThe Helm chart deploys the service as a LoadBalancer in the otel-api namespace with a Prometheus ServiceMonitor included.
Configuration
Section titled “Configuration”All configuration is controlled via environment variables:
| Variable | Default | Description |
|---|---|---|
port | 3000 | Port the HTTP server listens on |
kafka_host | localhost | Kafka broker hostname |
kafka_port | 9092 | Kafka broker port |
system_env | local | Environment prefix for Kafka topic names (e.g. dev, prod) |
ingest_topic | ingest | Topic name suffix for flattened/transformed events |
otelingest_topic | otelingest | Topic name suffix for raw OTEL events |
app_name | obsrv-otel-service | Service name used in logs and metrics |
Kafka topic naming convention:
Topics are constructed as {system_env}.{topic_suffix}. With defaults:
| Topic | Default name | Contents |
|---|---|---|
| Flattened events | local.ingest | Transformed, flat JSON — consumed by Obsrv |
| Raw OTEL events | local.otelingest | Original nested OTEL payload |
For a dev environment with custom topic names:
dev.ingest ← set system_env=dev, ingest_topic=ingestdev.otelingest ← set system_env=dev, otelingest_topic=otelingestSending events to the OTEL service
Section titled “Sending events to the OTEL service”Endpoint:
POST http://localhost:3000/network-observability/v1/in/<dataset-id>Content-Type: application/json| Parameter | Description |
|---|---|
dataset-id | The Obsrv dataset ID created in Step 3. Must match exactly. |
Request body format:
Wrap your raw OTEL payload inside a data object:
{ "data": { "resourceSpans": [ ... ] }}The same wrapper applies for logs and metrics:
{ "data": { "resourceLogs": [ ... ] }}{ "data": { "resourceMetrics": [ ... ] }}The service detects the signal type automatically — if the payload contains
resourceSpans,resourceLogs, orresourceMetricsit is treated as a standard OTEL v2 event and transformed accordingly.
Successful response (HTTP 200):
{ "id": "otel.data.in", "ver": "v1", "ets": 1747393761822, "params": { "resmsgid": "792c99b3-ab06-459e-86a3-2da6902306c6", "err": "", "status": "SUCCESSFUL", "errmsg": "" }, "responseCode": "OK", "result": { "message": "The data has been successfully ingested" }}Error response (HTTP 500):
{ "id": "otel.data.in", "ver": "v1", "ets": 1747393761822, "params": { "resmsgid": "...", "err": "SERVER_ERROR", "status": "FAILED", "errmsg": "Error message" }, "responseCode": "SERVER_ERROR", "result": {}}Maximum request body size: 5 MB per request.
What the service does internally
Section titled “What the service does internally”For each ingested event, the OTEL service:
- Validates the request body schema (requires a
dataobject). - Attaches the
datasetId(from the URL path) to the payload. - Detects the event format — standard OTEL (
resourceSpans/resourceLogs/resourceMetrics) or legacy v1. - Transforms the payload: unpacks OTel attribute arrays (
[{"key": ..., "value": ...}]) andkvlistValuestructures into flat key-value maps, promotes resource and scope fields to the top level, and explodes metricdataPointsinto individual events. - Adds processing metadata:
mid(message ID),syncts(sync timestamp), andobsrv_meta(source and routing info). - Publishes the flattened event to
{system_env}.{ingest_topic}and the raw event to{system_env}.{otelingest_topic}in parallel. - Increments Prometheus counters for monitoring.
Step 3 — Create an Obsrv dataset using the flattened schema
Section titled “Step 3 — Create an Obsrv dataset using the flattened schema”After the OTEL service transforms events, the flattened output looks like this:
Flattened Span (API trace)
Section titled “Flattened Span (API trace)”{ "resource": { "eid": "API", "producer": "iam", "producer.type": "Facilitator" }, "scope": { "name": "iam_service", "version": "1.0.0", "attributes": { "scope.uuid": "0dae9978-51cb-496d-882d-c6d632e52cba", "count": 1 } }, "edata": { "name": "userTokenGenerationV1", "startTimeUnixNano": "1747393760692953530", "endTimeUnixNano": "1747393761278953530", "status": "UNAUTHORIZED", "traceId": "fd8c2cea-f34a-43df-8c9c-dea27f338960", "spanId": "479c8550-fda2-4ba8-9446-2cf140b5042b", "mid": "792c99b3-ab06-459e-86a3-2da6902306c6", "ets": 1747393761822, "attributes": { "sender.id": "ma****@test.in", "span.uuid": "792c99b3-ab06-459e-86a3-2da6902306c6", "observed.time.unix.nano": "1747393760692942330", "request.method": "POST", "request.url": "/v1/user/token/generate", "response.status.code": "401", "response.time.ms": "586" }, "events": { "error": { "time": "2025-05-16T11:09:20.692589Z", "attributes": { "msg": "Invalid username/password", "code": "TKN_2025", "type": "UNAUTHORIZED" } } } }}Flattened Log (Audit)
Section titled “Flattened Log (Audit)”{ "resource": { "eid": "AUDIT", "producer": "iam-service", "producerType": "IAM" }, "scope": { "name": "iam_service", "version": "1.0.0", "attributes": { "scope_uuid": "ab9ba7fa-3954-46aa-b176-b7cc53671b56", "count": 1 } }, "edata": { "timeUnixNano": 1747138417347, "observedTimeUnixNano": "1747138417347597974", "severityNumber": "12", "traceId": "f8ddc431-5ce5-4c08-8adb-15e3ba7ee2c3", "spanId": "6bf31af5-df0f-4d3e-ab3c-e0c6ceda449c", "body": "User already exists with email testemail13k@yopmail.com", "mid": "695c032a-4a6a-4c59-a8fc-936ebb6bbd1d", "ets": 1747138418315, "attributes": { "state": { "email": "te**********@yopmail.com", "username": "te**********@yopmail.com", "firstname": "test", "lastname": "user" }, "type": "User", "log_uuid": "695c032a-4a6a-4c59-a8fc-936ebb6bbd1d", "status": "Failed", "id": "te**********@yopmail.com" } }}Use this flattened structure to define your dataset schema in Obsrv.
Step 4 — Query your data
Section titled “Step 4 — Query your data”Once the dataset is active and events are flowing through the pipeline:
- Superset — Use the Obsrv-connected Superset instance to build charts and dashboards directly on the dataset.
- Data Out API — Query programmatically via the Obsrv Data Out API.